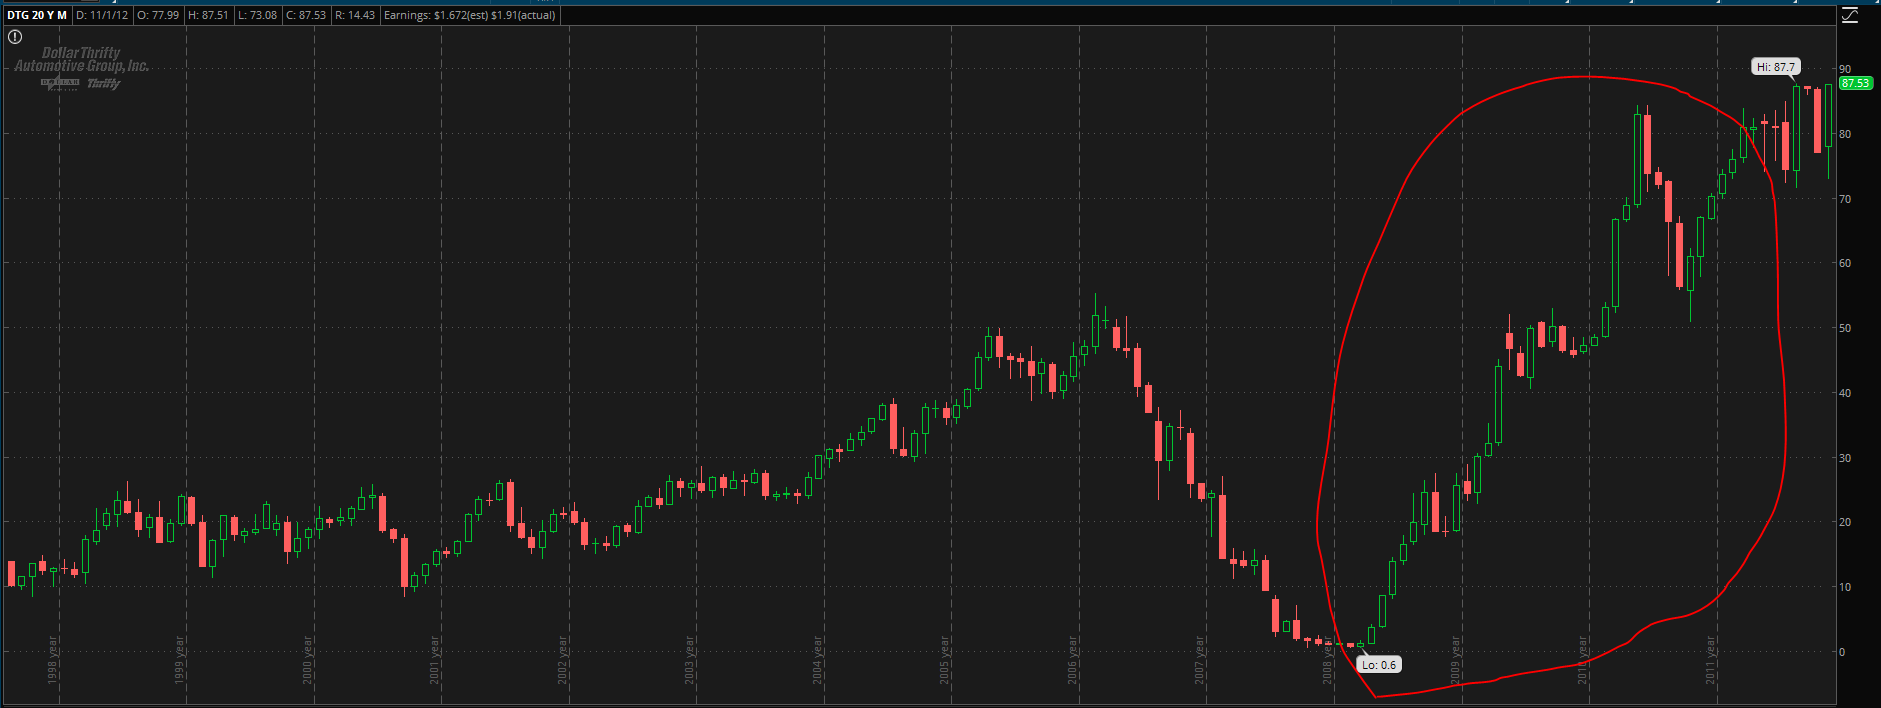
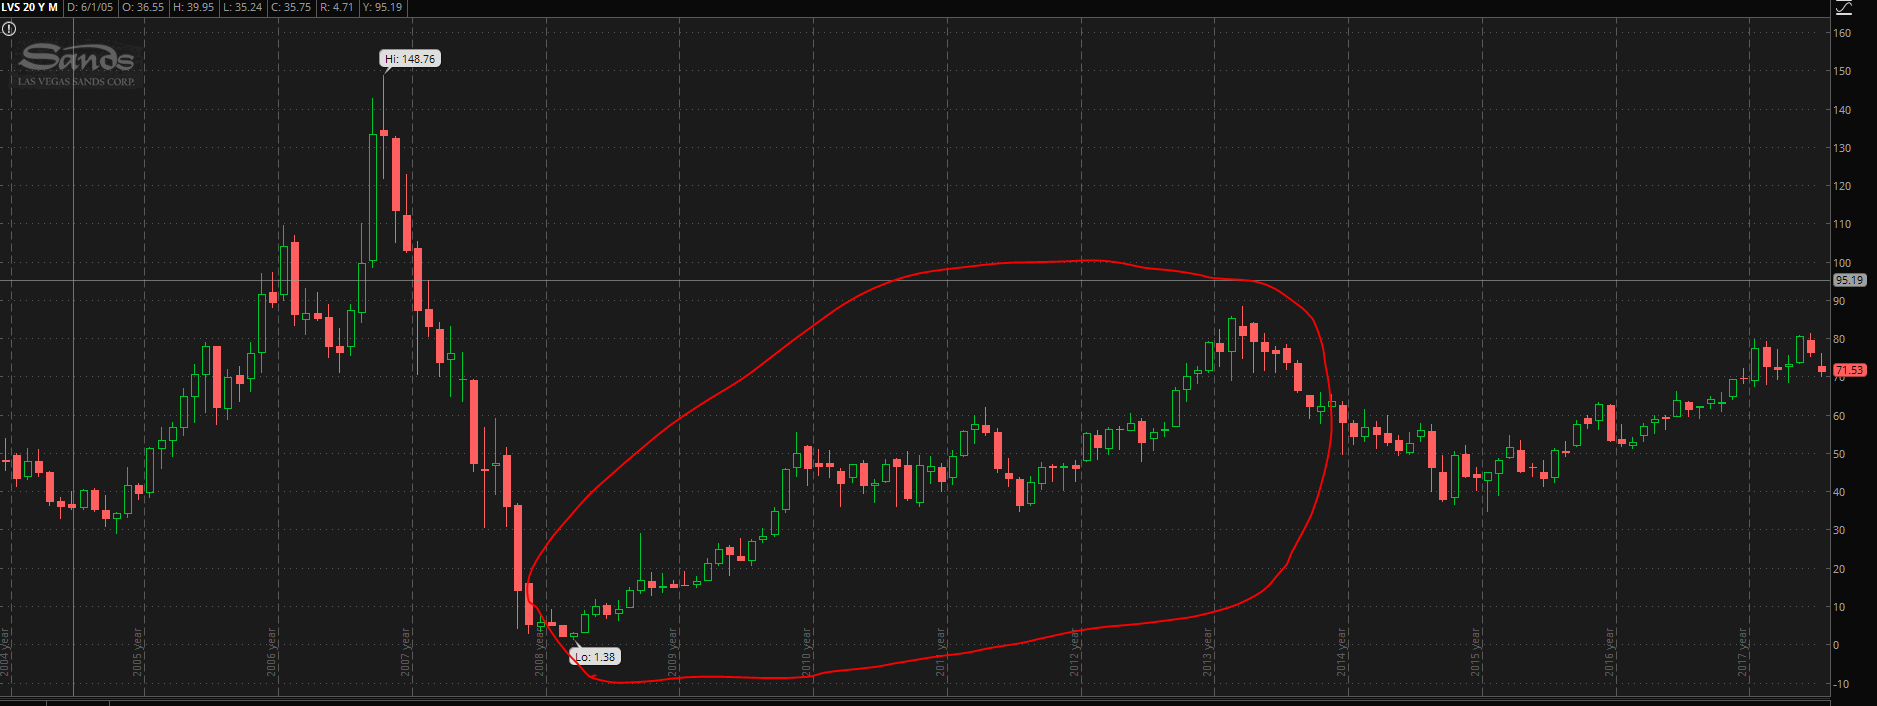
We aim to focus capital not only on our strategy, but on a specific time in the financial cycle when it is most advantageous to buy value. This is of course the late phase of a bear market or severe market correction through to the early stages of recovery. Companies' stocks that take huge beatings during bear markets but manage to overcome financial obstacles and weather the storm tend to enjoy huge fast and furious price surges once markets recover. Dollar Thrifty Automotive Group (DTG) for example fell to a financial crisis low of 60 cents before it and the market found their footing, eventually recovering to a price of 87 dollars per share today. A 14,500% return! Las Vegas Sands (LVS) fell from a pre-crisis high of $148 per share to a crisis low of $1.38 per share before recovering to $80 per share in 2014. 5800% in just five years.
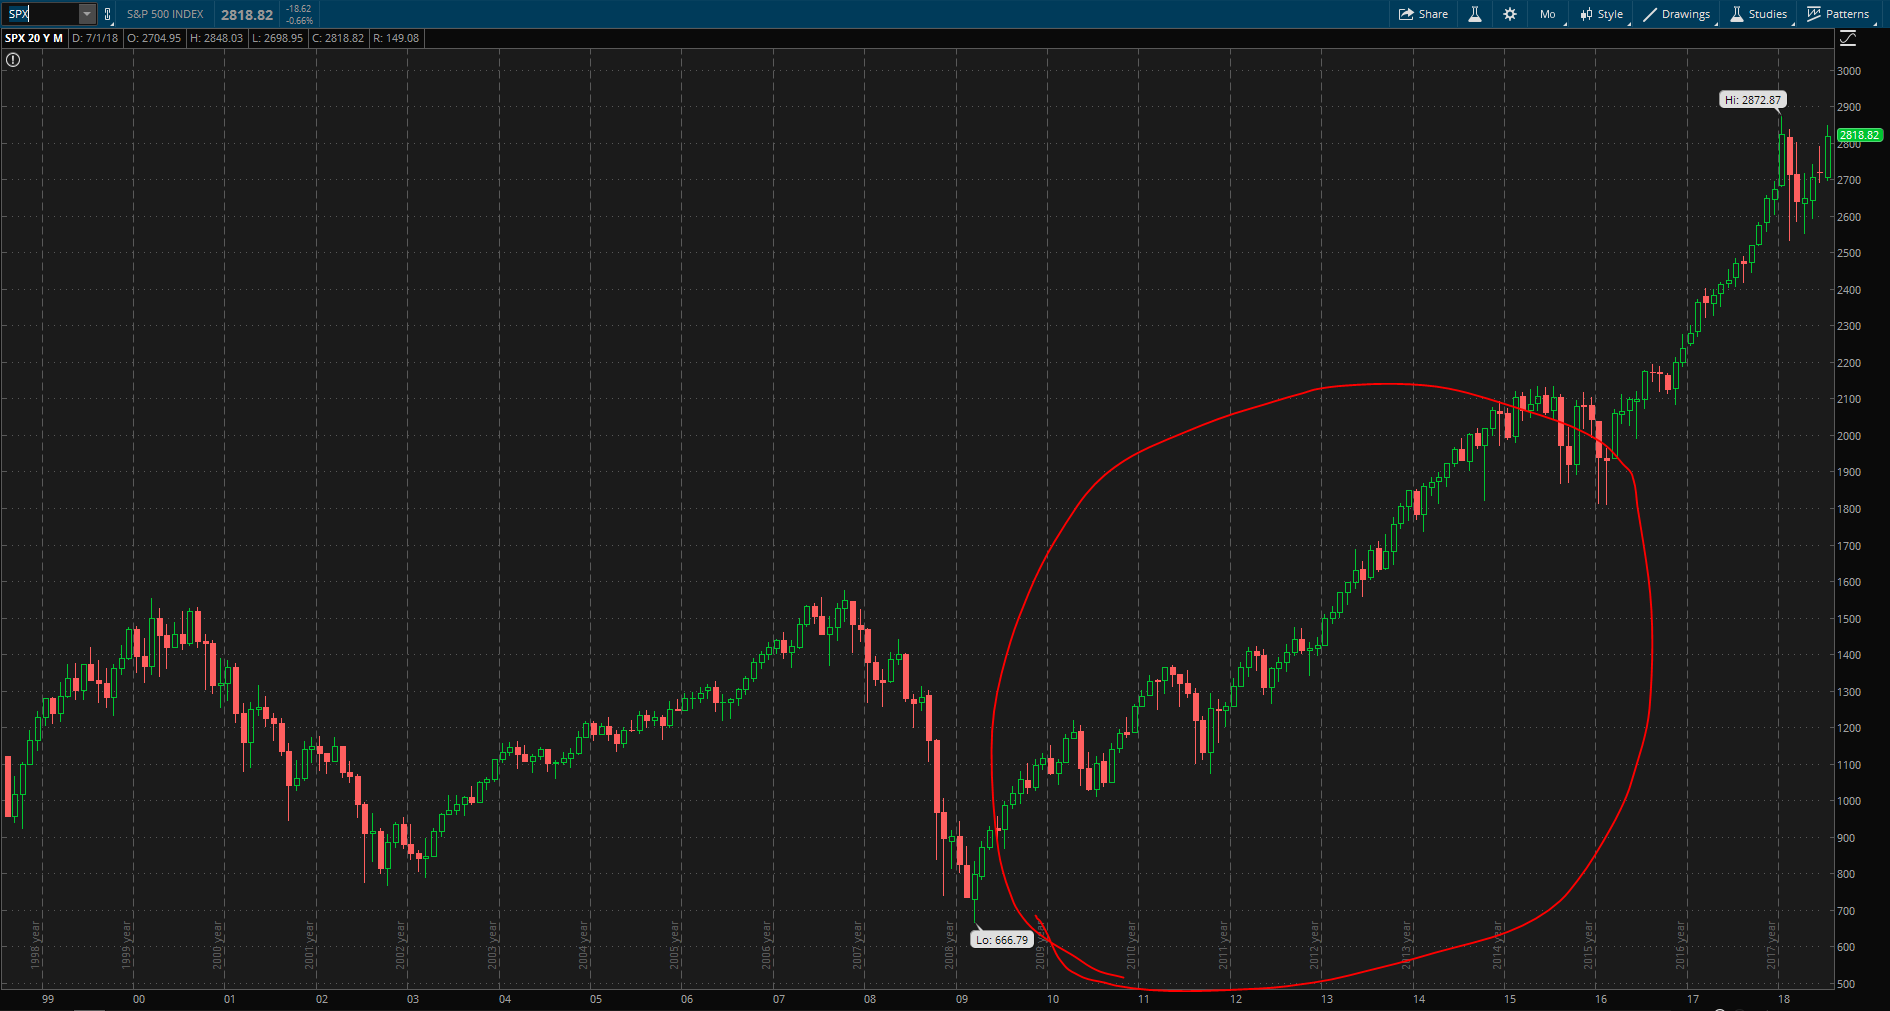
Most of these examples are in exception to the rule of course, but in this case the rule itself is still quite good. The broad S&P 500 gained over 300% in the five years following it's financial crisis low. That is the equivalent of getting a whopping 60% ROI just by buying an index when others were panic selling. Crisis breed opportunity, and with our current bull market approaching it's tenth year, it's only a matter of time until that window of opportunity opens once more. For those ready to raise their sails and ride the wind at least...
Traditionally, value investors spend their time pouring over balance sheets, income statements, crunching financial ratios and pouring over news sources. To do this for every publicly traded security out there would require so much overhead and human resources that by the time a few jewels were dug out of the proverbial dirt, costs can eat so far into returns that the outfit may just end up with none. At Sail we automate the tedious parts of securities analysis by leveraging our knowledge and application of computer technology to do the pouring over of the financial statements for us and alert us when a stock may be trading at a discount to it's intrinsic value. Once identified, we're able to focus our resources on investigating why the business is trading at such a discount and approximate the likelihood of the business surviving it's current situation and moving back into an enviornment in which it will thrive. These are the types of opportunities we are looking to deploy capital in.
And while a degree of market timing is included in our appoach, we would argue that we are not going to be attempting to time the market in the industry accepted sense of the phrase. We do not believe and certainly don't intend to trade as if we will be able to repeatedly call tops and bottoms in order to deliver benchmark beating returns. Rather we aim to strike only once. The intention is not to create opportunity by timing markets but to seize opportunity when it arises in the sense of an extremely favorable entry point for long term investment. Our philosophy is that while intrinsic value is objective, price on the other hand is like pendulum. We believe price never truly reflects value for more than a moment at a time. Most of the time price swings from one extreme to the other driven by human emotion rather than any tangible relationship to underlying value. The moments of extreme disconnect between the concensus price by market participants and the true value of an asset are the opportunites we look to capture.
When will we invest?
Over ten major market corrections since the Great Depression, the average move from peak to trough has been -46%, with a major outlier in the 1929 correction itself (from the market's peak in 1929 to it's bottom in 1932, the market corrected a whopping 82%). The market starts to become attractive to us once it crosses the threshold of being down over 30% from it's most recent peak.
| Years | High | Low | % Move To Bottom |
|---|---|---|---|
| 1929-1932 | 461.89 | 82.08 | -82% |
| 1937-1938 | 323.30 | 151.91 | -53% |
| 1946-1948 | 261.25 | 150.12 | -43% |
| 1956-1958 | 455.86 | 354.83 | -22% |
| 1968-1970 | 771.38 | 472.32 | -39% |
| 1972-1974 | 669.92 | 316.43 | -55% |
| 1980-1982 | 414.11 | 276.83 | -33% |
| 1987-1987 | 726.55 | 502.98 | -31% |
| 2000-2002 | 2212.78 | 1134.87 | -49% |
| 2007-2009 | 1868.55 | 873.29 | -53% |
What companies will we invest in?
We will be looking for companies with sound balance sheets, solid income statements and world class management whose share prices have been negatively affected by panic in the broader market. In the case of Dollar Thrifty (mentioned above), after the company's share price fell largely in part to it's dependence on credit markets the purchase of new vehicles to keep it's fleet up-to-date, now legendary Scott Thompson took over as CEO. Not only were there difficulties in the credit markets, but Dollar generally was buying GM cars for it's fleet, which was itself in quite some trouble at the time. Scott was able to cut costs, secure financing and get the company back on solid ground. Eventually markets recovered and tailwinds boosted the stock to it's astronomical 14,500% gain. While DTG is an outlier and was of course viewed as high-risk at the time (otherwise it would not have been priced down so extremely) it is a shining example of an awesome value play made available by extreme market turbulence.